
TrendSpott
Find new investment opportunities based on Market Sentiment Indicator. Manage watchlist risk with leading indicator of volatility See what influential analysts and investors are saying about stocks in your watchlist
Most Trending
-10.45%
-1.55%
+3.98%
-0.47%
TRP

43.07
48.57
54.14
49.65
Rewards
![]()
Earnings are forecast to grow
Technical Indicators
![]()
Price dropped 5 days in a row
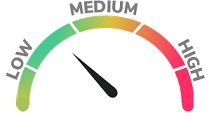
TC Energy (TRP) has Moderate Risk Level
Click here to check what level of risk are you willing to take in your portfolio
Earnings
![]()
Earnings increase YoY
![]()
Above analyst estimates
Rating
Momentum
![]()
Has been gaining momentum
Activity
Potential
![]()
Earnings are forecast to grow
![]()
Analysts opinion is negative and it remained unchanged from the past 3 months
![]()
Street view is bullish and have postive views on the near-term outlook
Wed Nov 30, 2022
Wed Nov 30, 2022
Tue Nov 29, 2022
Tue Nov 29, 2022
Mon Nov 28, 2022
Wed Nov 9, 2022
Wed Nov 9, 2022
Wed Nov 9, 2022
Thu Nov 3, 2022
Thu Oct 20, 2022
Tue Sep 27, 2022
Get all the pieces of the puzzle on important data activity before the major news sources break the story and find out what happening right now and what could happen in the future
FIND US ON
Receive our daily TRP alerts
Enter your email to receive daily alerts
SECURITY POWERED BY
Leading Gainers
Upgrades
Downgrades
Top Leaders
Ipo's
Dividend
Option Activity
Insiders Activity
Institutional Holdings
New Products
FDA Approvals
Agreements
Financial Reports
Disclaimer:
The Score performance whether actual or indicated by historical tests of strategies, is no guarantee of future performance or success. The results reflect performance of a strategy not historically offered to investors and does not represent returns that any investor actually attained.
The results reflect performance of a strategy not historically offered to investors and does not represent returns that any investor actually attained. The Readiness Indicators, Sentiment Indicators and total score are calculated by the retroactive application of a model constructed on the basis of historical data and based on assumptions integral to the model which may or may not be testable and are subject to losses. Active trading is generally not appropriate for someone of limited resources, limited invesment or trading experience, or low-risk tolerance. Your capital may be at risk.
Please note that no offer or solicitation to buy or sell securities, securities derivatives of future products of any kind, or any type of trading or invesment advise, recommendation or strategy, is made, given or endorsed by TrendSpott including any of their affiliates ("TS").
This information is provided for illustrative purposes only. You should not rely on any advice and/or information contained in this website and before making any investment decision. we recommend that you consider whether it is appropriate for your situation and seek appropriate financial, taxation and legal advice.
Most Trending
-10.45%
-1.55%
+3.98%
-0.47%
Summary
TC Energy (TRP) gets an overall score of 4.24 based on 15 events in the past 90 days from financial news and social media on a scale of 1 (strong sell) to 5 (strong buy). Last updated Dec 2, 2022 11:40
Rewards
![]()
Earnings are forecast to grow
Technical Indicators
![]()
Price dropped 5 days in a row
![]()
Street view is bullish and have postive views on the near-term outlook
Earnings
![]()
Earnings increase YoY
![]()
Above analyst estimates
Rating
Momentum
![]()
Has been gaining momentum
Activity
Potential
![]()
Earnings are forecast to grow
![]()
Analysts opinion is negative and it remained unchanged from the past 3 months
Get all the pieces of the puzzle on important data activity before the major news sources break the story and find out what happening right now and what could happen in the future
FIND US ON
![]()
![]()
![]()
Receive our daily TRP Alerts
Enter your email to receive daily alerts
SECURITY POWERED BY
Disclaimer:
The Score performance whether actual or indicated by historical tests of strategies, is no guarantee of future performance or success. The results reflect performance of a strategy not historically offered to investors and does not represent returns that any investor actually attained.
The results reflect performance of a strategy not historically offered to investors and does not represent returns that any investor actually attained. The Readiness Indicators, Sentiment Indicators and total score are calculated by the retroactive application of a model constructed on the basis of historical data and based on assumptions integral to the model which may or may not be testable and are subject to losses. Active trading is generally not appropriate for someone of limited resources, limited invesment or trading experience, or low-risk tolerance. Your capital may be at risk.
Please note that no offer or solicitation to buy or sell securities, securities derivatives of future products of any kind, or any type of trading or invesment advise, recommendation or strategy, is made, given or endorsed by TrendSpott including any of their affiliates ("TS").
This information is provided for illustrative purposes only. You should not rely on any advice and/or information contained in this website and before making any investment decision. we recommend that you consider whether it is appropriate for your situation and seek appropriate financial, taxation and legal advice.
Top Headlines
Wed Nov 30, 2022
Tue Nov 29, 2022
Tue Nov 29, 2022
Mon Nov 28, 2022
Wed Nov 9, 2022
Wed Nov 9, 2022
Thu Nov 3, 2022
Thu Oct 20, 2022
Tue Sep 27, 2022